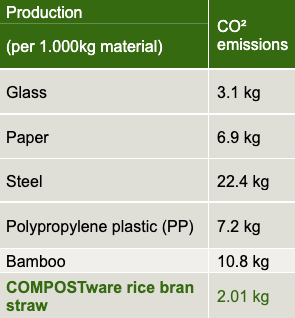
Carbon emissions are calculated from production to factory gate.
Only materials are compared, without packaging.
Cup comparison: The image shows three types of multi-purpose cups and their carbon footprint: Ceramic cups produce 2 kg CO₂ per cup Plastic cups produce 0.2 kg CO₂ per cup FRENVI reusable cups produce 0.12 kg CO₂ per cup
Environmental impact: Using 1,000 FRENVI REuse cups instead of traditional options leads to significant CO₂ reductions:
CO₂ reductions:
Saves 1,800 kg CO₂ compared to ceramic cups Saves 80 kg CO₂ compared to plastic cups
Comparison of transport: The transport comparison helps to visualize how significant the CO₂ savings are, showing equivalent travel distances for different modes of transport. For example, the CO₂ saved by switching 1,000 cups from ceramic to FRENVI reuse is equivalent to the emissions from a 51,429 km train journey.